As we have long assumed , in some papers related to the Channel-Link-State- dependent scheduling mechanisms, that a bad link or channel state is not affecting the existing good links, the only need for scheduling is to save the bandwidth wasted by the bad link, such as allocate more bandwidth to good one.
Does this assumption really true? No.
My results show that it really depends on different back-off scheme.
In summary, In wireless environment, a good collision-handling schemes ( associated with back-off ) should meet following requirements:
Let's first assume each time a packet is going to be send, a backoff timer is used. This is true in 802.11 DCF and achieve fairness.
During time interval T. T is represented in the number of TimeSlot.
There are M stations in the network. And each has N packets to arrive periodically
in this time duration T. Each packet has a length of L ( equivalent to
L Timeslots, means it took the link K timeslot to transmit this packet).
L is fixed, so packet length does not change in this model. As packet length
is fixed,
we can also infer the PER (packet error rate) has a simple relation
to BER.
Each station has a probability, p1, p2, p3,......
pM of PER.
As, in above model, Link rate is not needed, because all rate-parameters
are transposed to Timeslot-related.
No RTS/CTS, no ACK,
Backoff time is also some numbers of basic Timeslots.
Three Different Schemes:
Simulation Set 1: Exponential Back-off
Scheme CWmin = 2, CWmax = 64 )
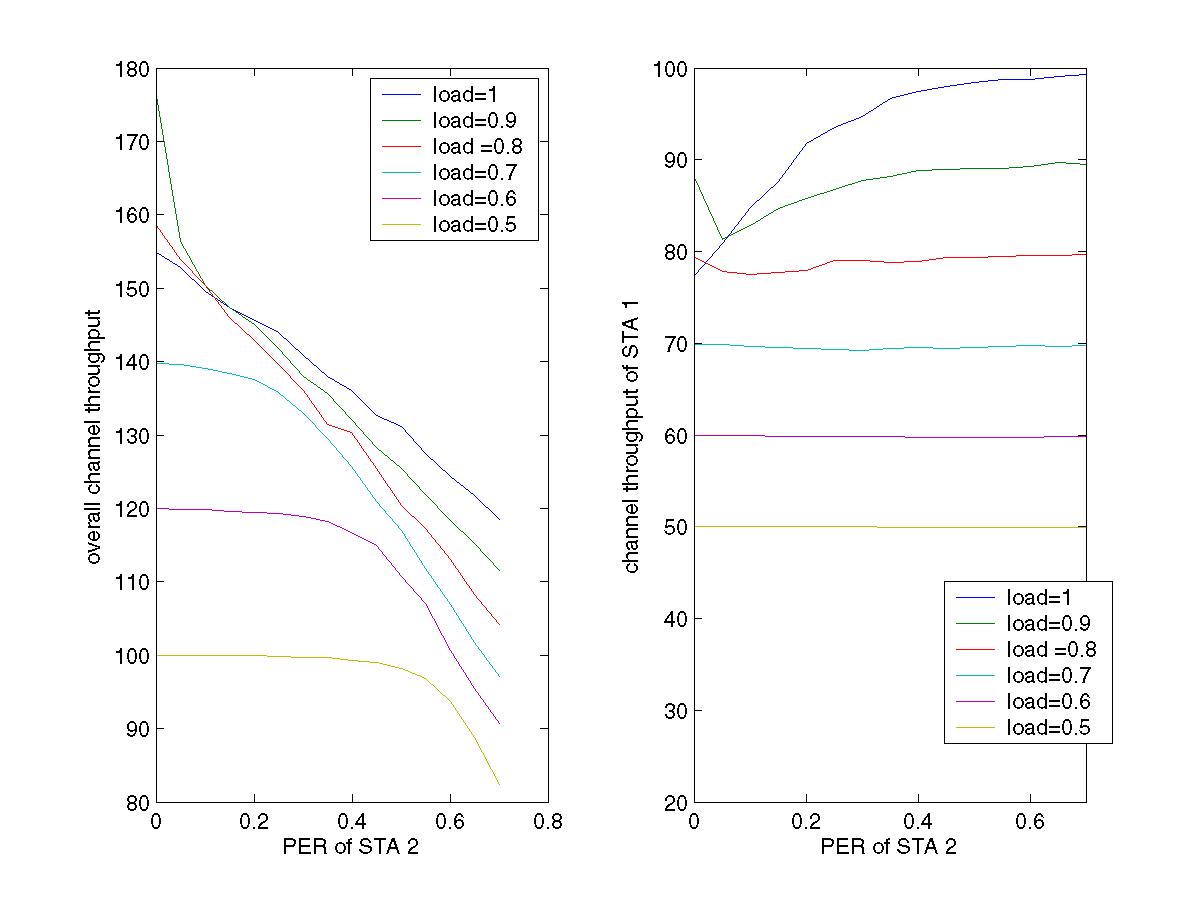
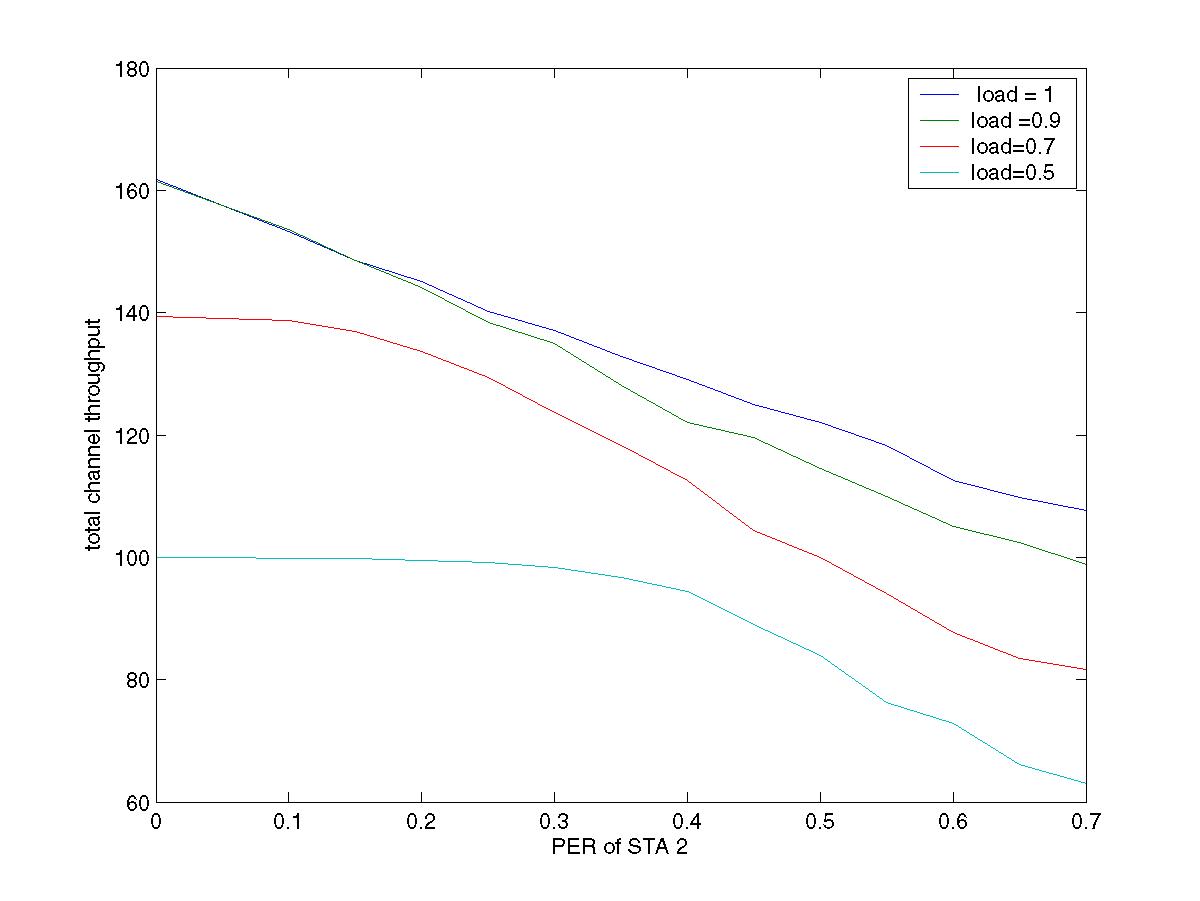
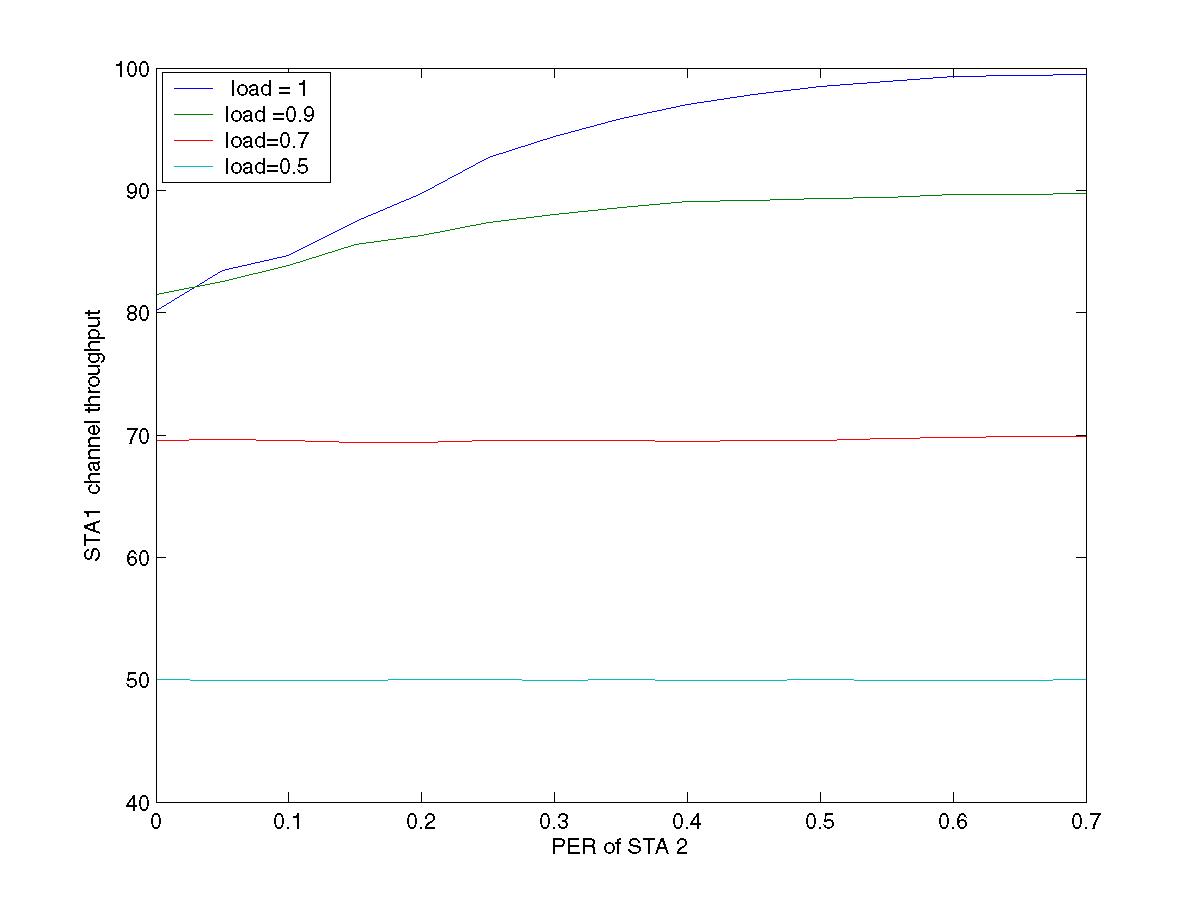
Scene 1: Assume M = 2 stations, let's change one station with
PER increasing. Then observed the overall channel throughput variance and
the throughput change of one STA with still zero PER ( perfect link).
Figure
of Scene 1: The overall throughput and signal link throughput comparison
(Associated
MAT file, variable 'Sim_06_01', 'Sim_06_02')
Scene 2: Assume M = 5 stations, let's change one station with
PER increasing. Then observed the overall channel throughput variance and
the throughput change of one STA with still zero PER ( perfect link).
Figure
of Scene 2: The overall throughput and signal link throughput comparison
(Associated
MAT file, variable 'Sim_07_01', 'Sim_07_02')
Scene 3: Assume M = 2 stations, let's change one station with
PER increasing. Then observed the overall channel throughput variance and
the throughput change of one STA with still zero PER ( perfect link).
Figure
of Scene 3: The overall throughput and signal link throughput comparison
(Associated
MAT file, variable 'Sim_00_01', 'Sim_00_02')
Scene 4: Assume M = 5 stations, let's change one station with
PER increasing. Then observed the overall channel throughput variance and
the throughput change of one STA with still zero PER ( perfect link).
Figure
of Scene 4: The overall throughput and signal link throughput comparison
(Associated
MAT file, variable 'Sim_01_01', 'Sim_01_02')
Simulation Set 2: Exponential Back-off Scheme CWmin = 32, CWmax = 1024 )
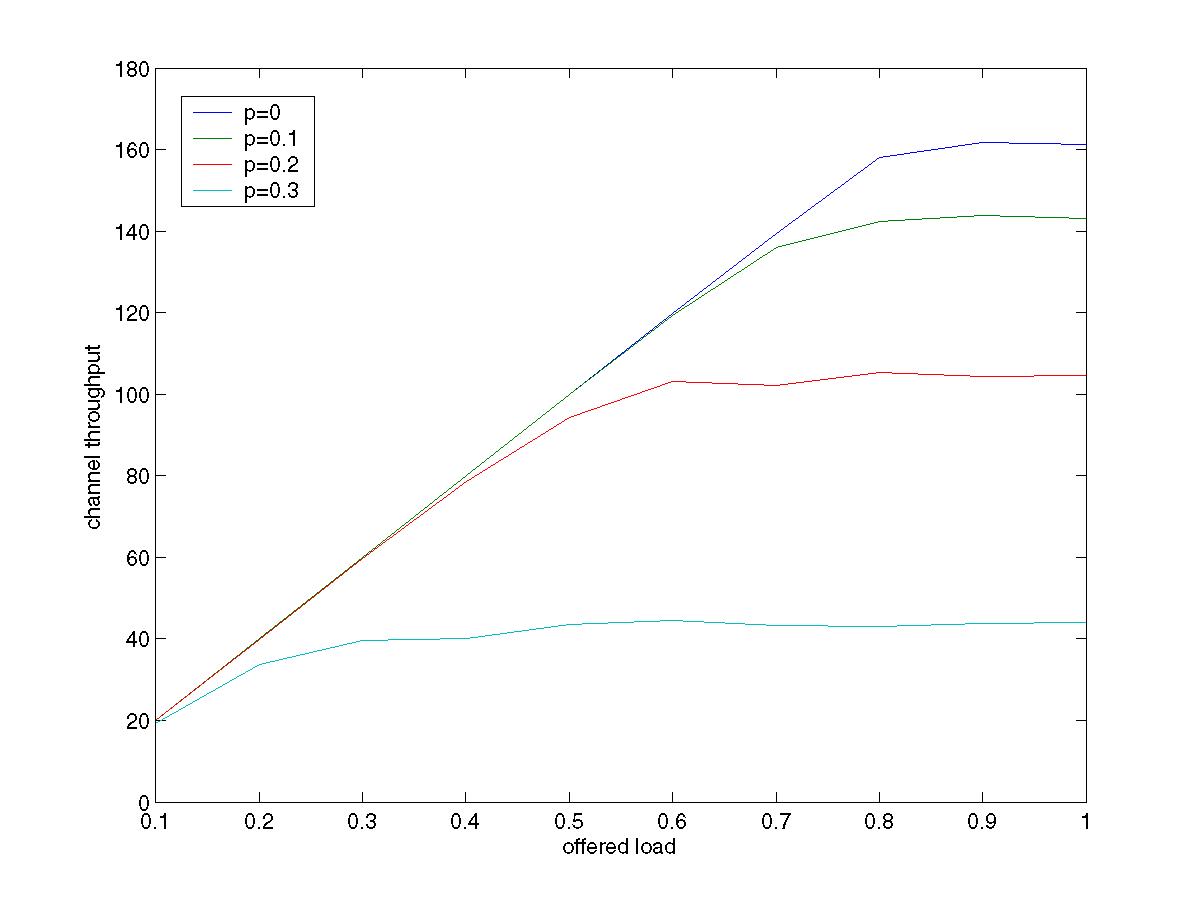
Scene 1: Channel Throughput Comparison .vs. offered load. vs. packet
loss rate ( when M = 2)
Figure
. of Scene 1: The overall throughput drops a quickly (Associated
MAT file, variable 'd' )
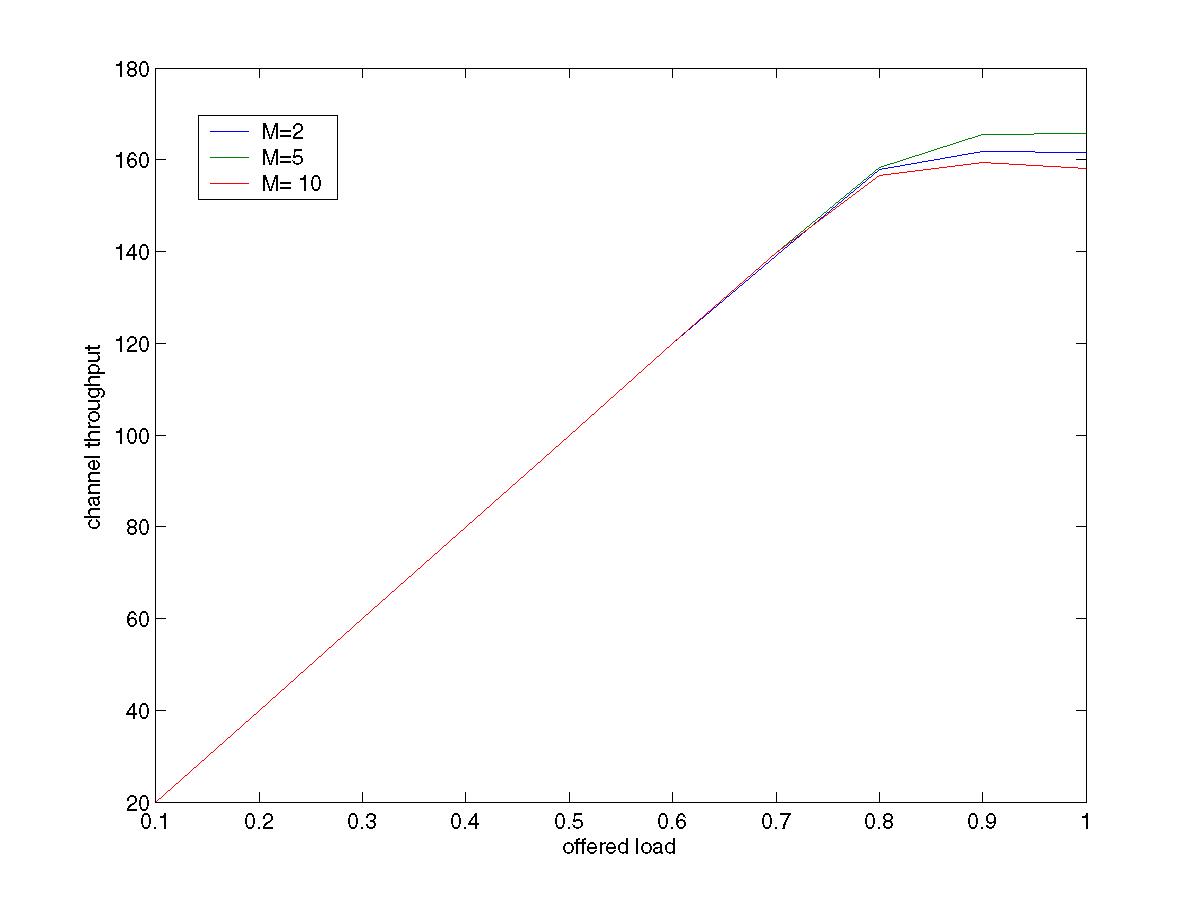
Scene 2: Assume each STA has 0.0 PER (perfect reception) .vs. offered
load, adjust N, to see the variance of channel throughput
and adjust M, number of stations, as M= 2, 5, 10
Figure
. of Scene 2: The overall throughput varies a little (Associated
MAT file, variable 'c' )
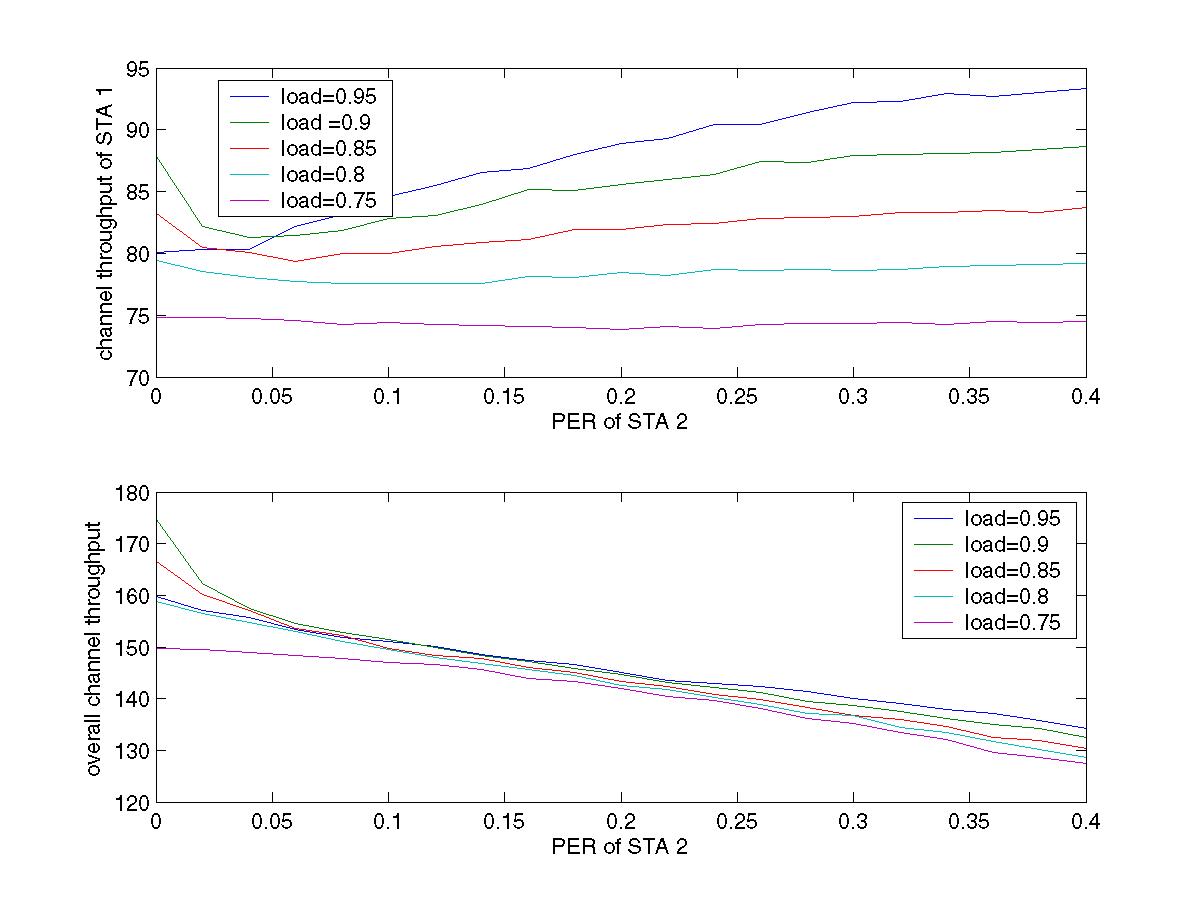
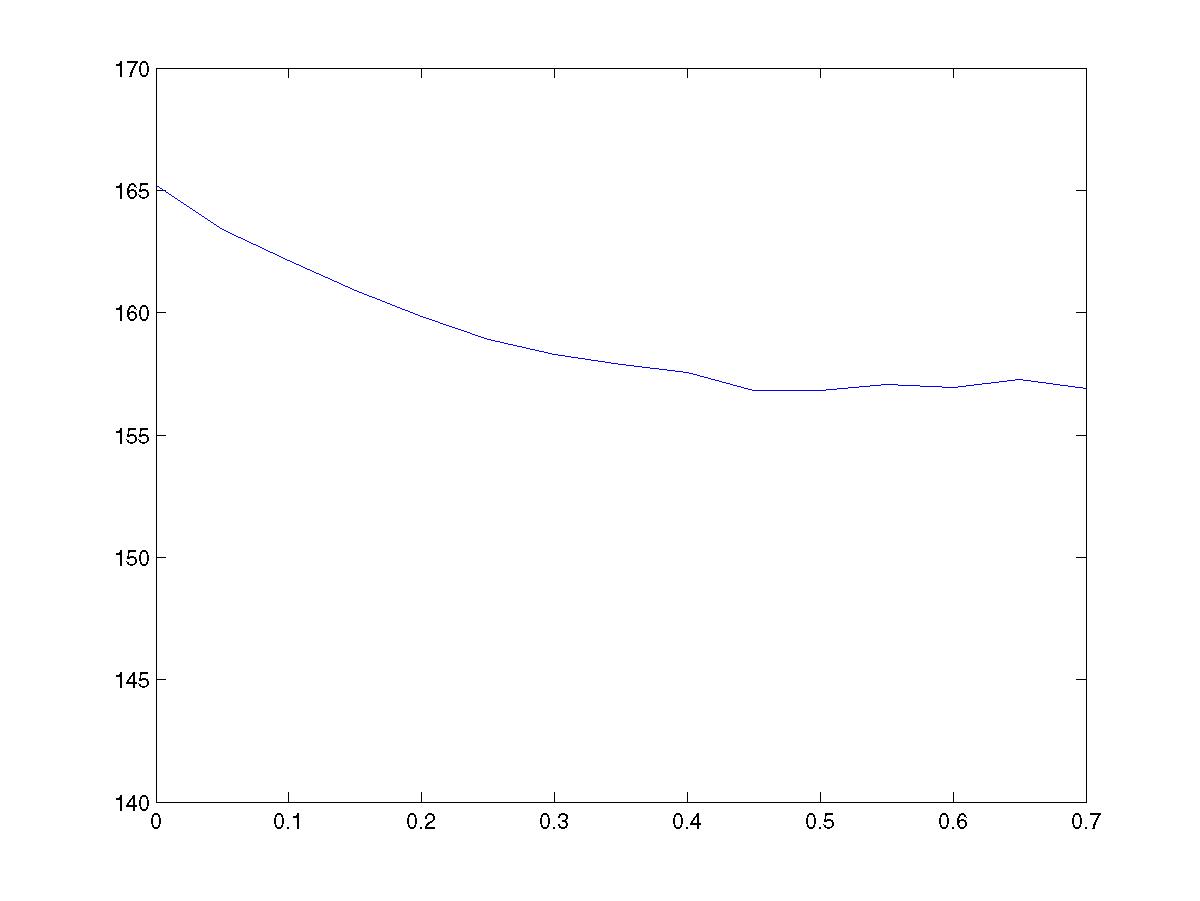
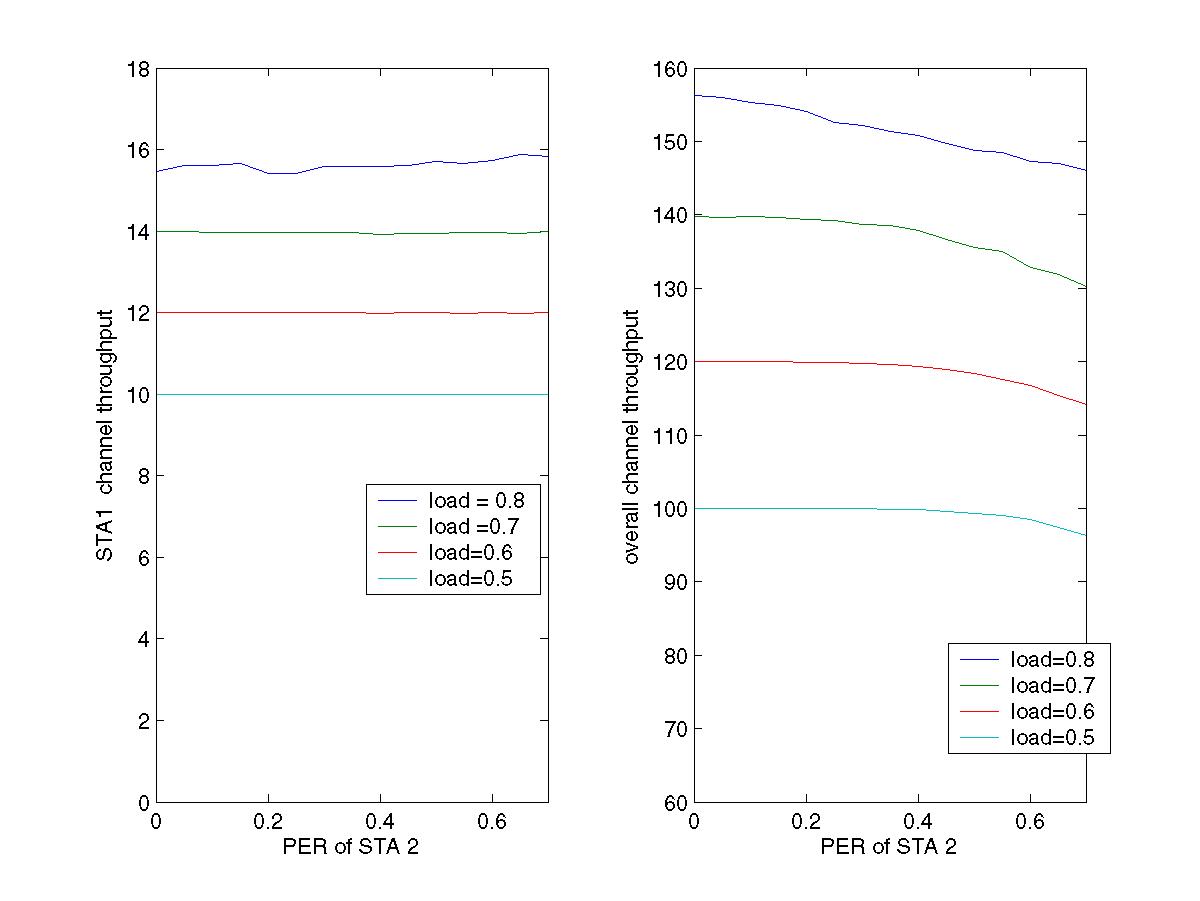
Scene 3: Assume M = 5 stations, let's change one station with
PER increasing. Then observed the overall channel throughput variance and
the throughput change of one STA with still zero PER ( perfect link).
Figure
A. of Scene 3: The overall throughput drops a little (Associated
MAT file, variable 'a', 'b')
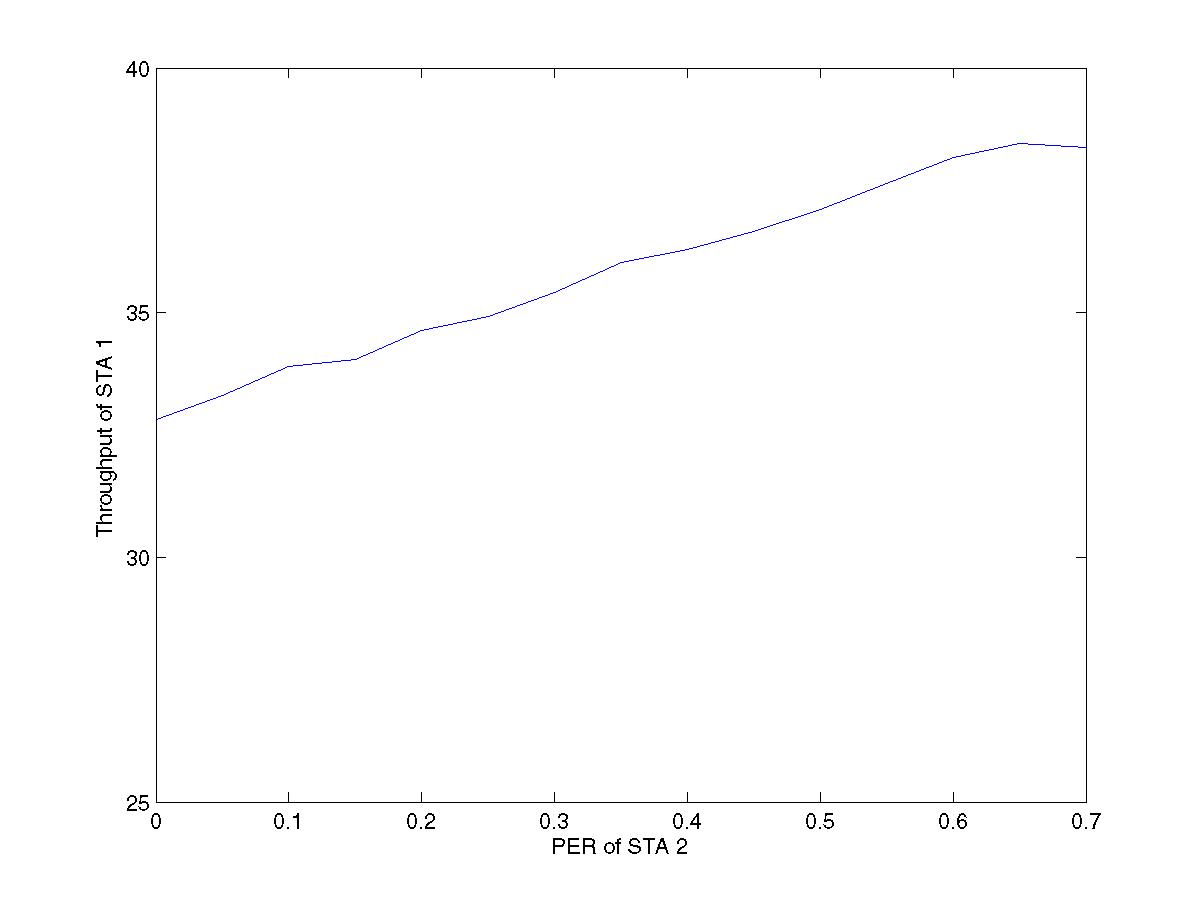
Figure
B. of Scene 3: The throughput of STA 1 increases a little
(Associated
MAT file, variable 'wu04')
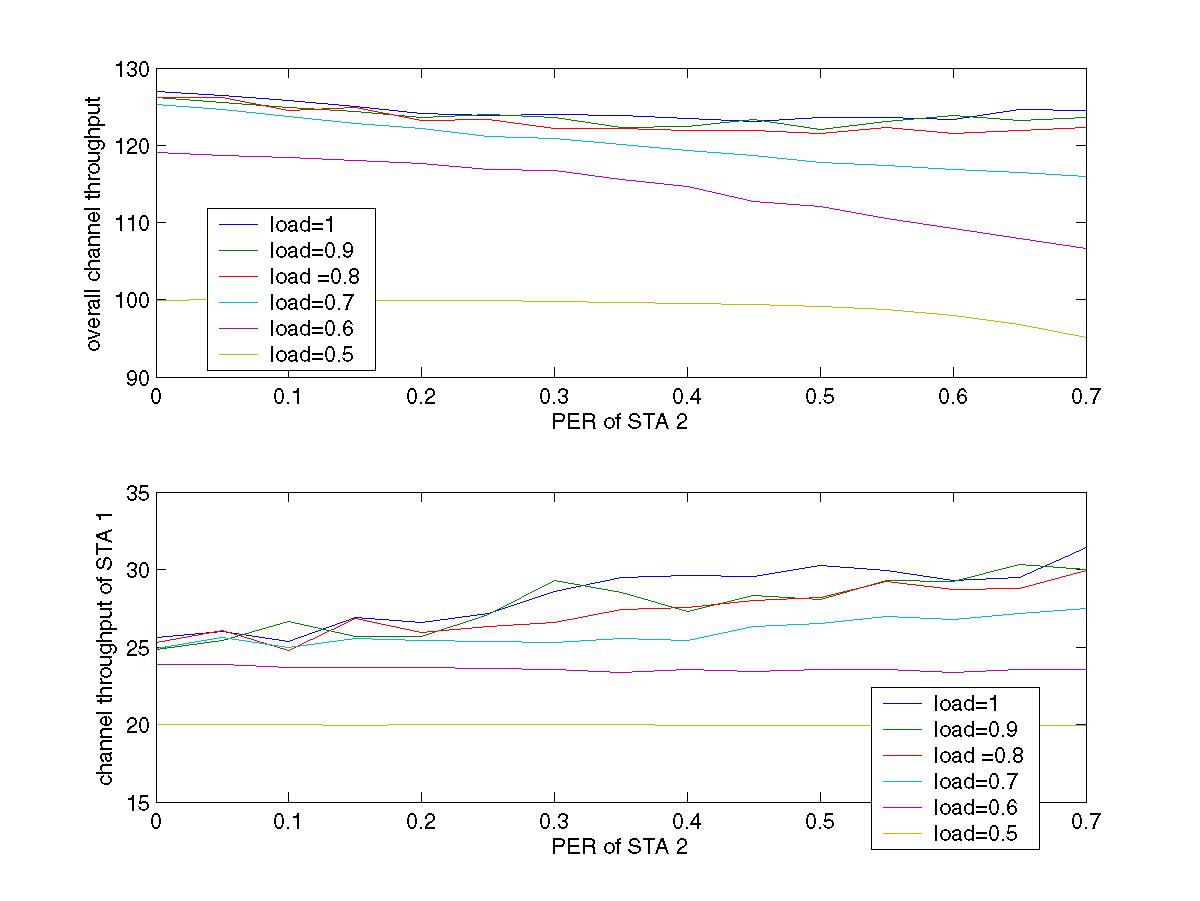
Scene 4: Assume M = 2 stations, let's change one station with
PER increasing. Then observed the overall channel throughput variance and
the throughput change of one STA with still zero PER ( perfect link).
Figure
A. of Scene 4: The overall throughput drops (Associated
MAT file, variable 'Sim_03_01', 'Sim_03_02')
Figure
B. of Scene 4: The throughput of STA 1 increases
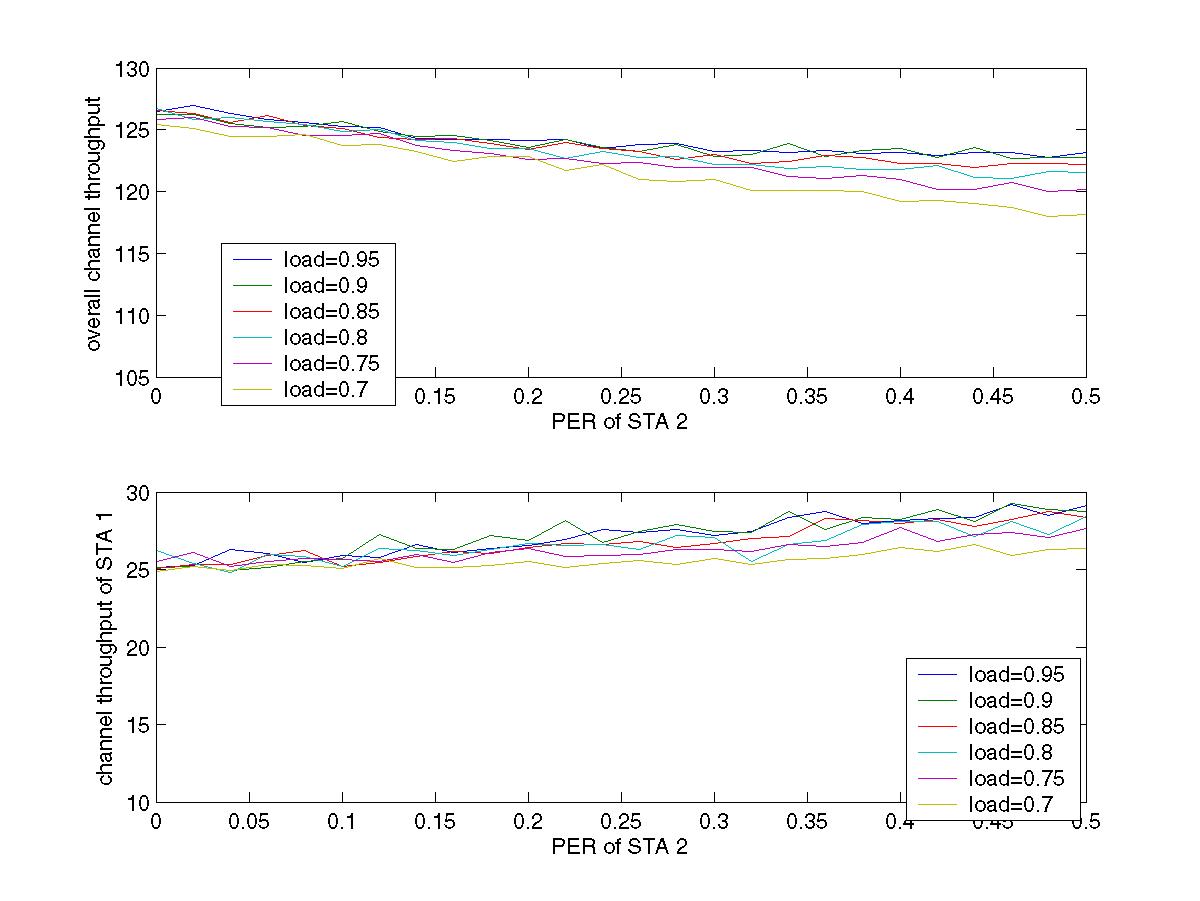
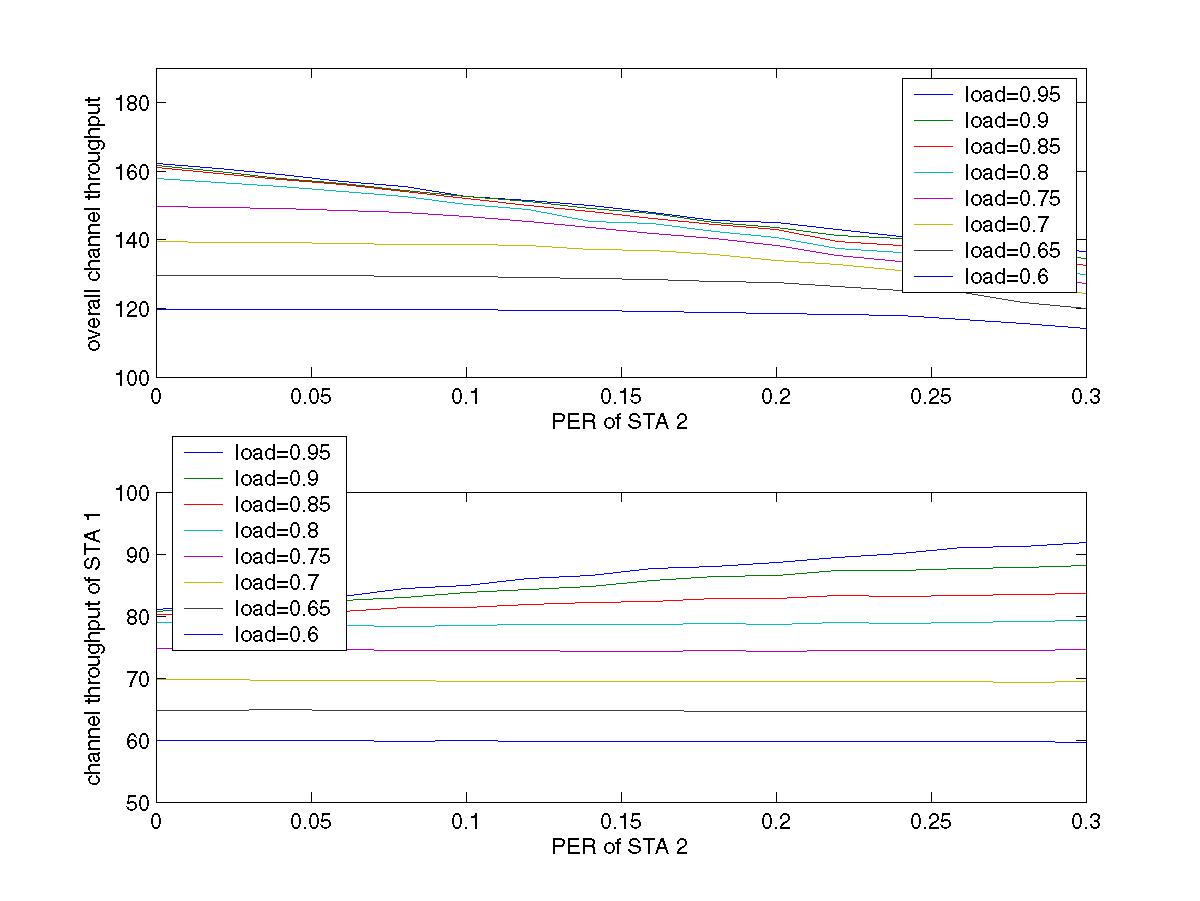
Scene 5: Assume M = 10 stations, let's change one station with
PER increasing. Then observed the overall channel throughput variance and
the throughput change of one STA with still zero PER ( perfect link).
Figure
of Scene 5: The overall throughput and throughput of STA1 varying
(Associated
MAT file, variable 'Sim_05_01', 'Sim_05_02')
Scene 6: Assume M = 2 stations, let's change one station with
PER increasing. Then observed the overall channel throughput variance and
the throughput change of one STA with still zero PER ( perfect link).
Figure
. of Scene 6: The overall throughput drops and STA1 remains constant
(Associated
MAT file, variable 'Sim_02_01', 'Sim_02_02')
Conclusion
Source code:
Backoff_expo.m (there
is a minor error in the file, "round" should` be "floor")